USD/JPY
|
Monday 2014-11-10 08:39:03
|
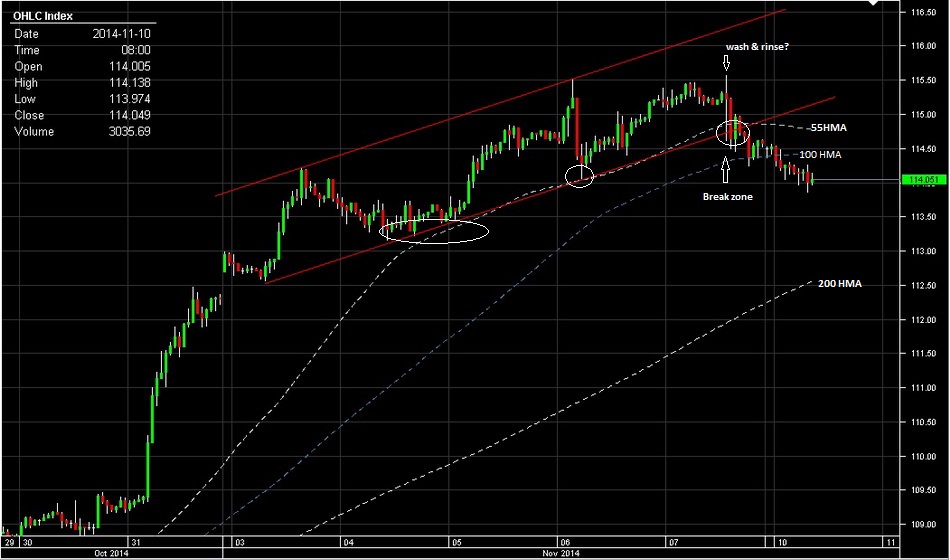
After BoJ has decided to aggressively ease further to expand its already massive monetary stimulus plan on the 31st of October 2014 into the economy, Japanese Yen has been weakening from around 110 level against the US Dollar to around 115.50 area without any big pullback yet. The pair had been creating an uptrend channel(look at the chart below) and was able to stay above a 55HMA for a while until it broke below it. The 55HMA also coincided with the uptrend channel. When it broke 55HMA it simultaneously broke the lower channel line of this upward channel. The pair seems to lose its upside momentum and also breaks the 100HMA after OCT. US NFP data which came in a bit below expected. However the unemployment rate falls to 5.8% vs 5.9%. To me this data is not bad at all. In fact it's quite good in my opinion. The revision of this data from Sep. is up to 256K from 248K prior.
After the NFP released USD/JPY made a new high. However it couldn't only continue to go higher but also fell and broke below the upward channel, 55HMA and as well as the 100HMA. This creates a good double top pattern because it also did the wash and rinse of the previous high at 115.51. This might be a start of the short-medium term reversal since it rallies from 105.19 low on Oct. 15, 2014.
However, this is not for the long term play. I still believe that the pair might still be in the uptrend for the bigger picture but for how long? I don't know but BoJ also concerns that too week Yen is not also a good thing. I heard that they might start to intervene if the currency keep weakening to around 120 level. Furthermore, you should be very cautious at this point when you trade it to the upside because this pair has its correlation to the risk aversion and I've been still very cautious with the equity markets that it's in a due for a big correction in my opinion, even though the BoJ is still easing further monetary policy.
I would play against the top here at 115.57 and take profit can be varied until around the 111.60 which is the 38.6 Fib retracement of the rally between 105.19 and 115.57. Wait for a rally to sell into. Manage your risk and good luck on your trading.
|
|
|
Back to Top
|
Disclaimer: The information in this content represents my own opinions, knowledge, and experience that I’ve learnt and been through. So in sharing this information is to help you with ideas to include in your research before making a decision to either trading or stepping into this part of investment. Please read the full Risk Disclaimer in the term and condition section. |
|
|
